Home / Research / Company deep dive
Company deep dive · The rebuild, measured
Opendoor: the cost of rebuilding
Opendoor is trying to stop being a house flipper and become a housing platform — earning fees for helping people buy and sell, instead of owning every home itself. In Q3 2026 it lost $218 million doing it, the stock fell 22% on Friday, and management admitted it is behind on its own profit deadline. This deep dive opens the loss, does the cash math properly, and sets the five tests that decide whether the rebuild is real.
Position disclosure — November 8, 2026: of the names this piece covers, the desk currently holds none. Its full position book (QCOM · AVGO · TSLA · GOOGL · SNDK · MU) prints in the open in the current editions.
Fact checked — every figure verified against the Q3 2026 earnings release, the Form 10-Q and the earnings-call transcripts · November 8, 2026.
Section 01The verdict
The opportunity is real; the proof is not there yet. A broken business does not become a better business simply because it keeps losing money. It becomes better when management changes the mechanism that produced those losses — and Opendoor's mechanism genuinely is changing, from owning homes to serving transactions. Roughly 9,000 serious sellers reach its platform every week; for years, most of them walked away from an all-or-nothing cash offer. A platform that serves them without buying their homes could be larger and more durable than the flipper it replaces.
But a transition visible in a funnel chart is not yet a transition visible in cash. Gross margin fell to 3.7% in Q3, contribution margin fell for a second straight quarter and was guided lower again, the company bought nearly twice as many homes as it sold heading into winter, and management concedes it is behind schedule on adjusted net income. Patience is reasonable here — but only with a scoreboard. Section 11 sets out ours: five measurable tests, and the one yardstick management itself supplied.
Every figure below is traced to Opendoor's Q3 2026 release, its Form 10-Q, its earnings calls, or its own product pages — checked on November 8, 2026. Where a number is our own illustrative assumption rather than a company figure, it is labelled as such, in the text, every time.
Know / think / don't know — how to read this piece. Know (from the filings): the loss bridge, the margins, the cash, the debt, the funnel counts — every figure in Sections 02–05. Think (our judgment): the platform opportunity is real, the proof is not there yet, and two of the five scoreboard tests are currently moving the wrong way. Don't know (nobody outside the company does): whether each 3P transaction actually makes money — Opendoor does not disclose it — or how often Cash Now, More Later sellers ever see a second payment.
Section 02What happened Friday
The arc matters. This stock bottomed near $0.51 in June 2025 with Nasdaq delisting risk hanging over it. Then came the meme run — a prominent investor called it "the next Carvana," the shares rose roughly 1,600% to above $10 by mid-September 2025, and a new chief executive, Kaz Nejatian from Shopify, took over on September 10, 2025. The stock closed 2025 at $5.83. It has since given back about 76% in 2026, and Friday's post-earnings drop took it to $1.40. This is a battleground stock, and Friday was the bears' day.
Section 03What $1.40 is saying
This piece offers no price target — deliberately. But a price is itself information, and it can be read backwards. At Friday's $1.40 close, with about 930 million shares outstanding, the market values the whole company at roughly $1.3 billion. Against that: Opendoor holds $910 million of cash (plus $98 million restricted) — about 98 cents of cash per share against a $1.40 share price. Before concluding the operating business is being given away, count what stands against the cash: $3.06 billion of debt ($2.36 billion asset-backed, $698 million convertible) — most of it borrowed against the 7,596 houses carried on the books at $2.57 billion. Put together, the market values the enterprise at roughly $3.4 billion — about 1.3 times the carrying value of the houses alone.
So here is what each side has to believe. To own it here, you believe the houses are worth roughly what the books say, and that the shift toward fee-based business bends the margins before the financing gets tight. To short it here — and about a quarter of the shares are sold short — you believe housing softens into that inventory, the marks come down again, and shareholders keep funding the gap: stock pay alone is guided at roughly $90 million for Q4. Neither belief is crazy. The scoreboard in Section 11 is how you tell which one is aging better.
Section 04Inside the loss: what the $218 million is made of
Start with the reported GAAP loss: $218 million. Opendoor's adjusted loss is $66 million. The bridge between them has three pieces: $108 million of stock pay ($12 million of regular stock compensation plus $96 million tied to market-condition stock awards), $42 million of inventory timing — write-downs and reversals on homes, netted — and $2 million of everything else, netted. The arithmetic reconciles exactly: −218 + 108 + 42 + 2 = −66.
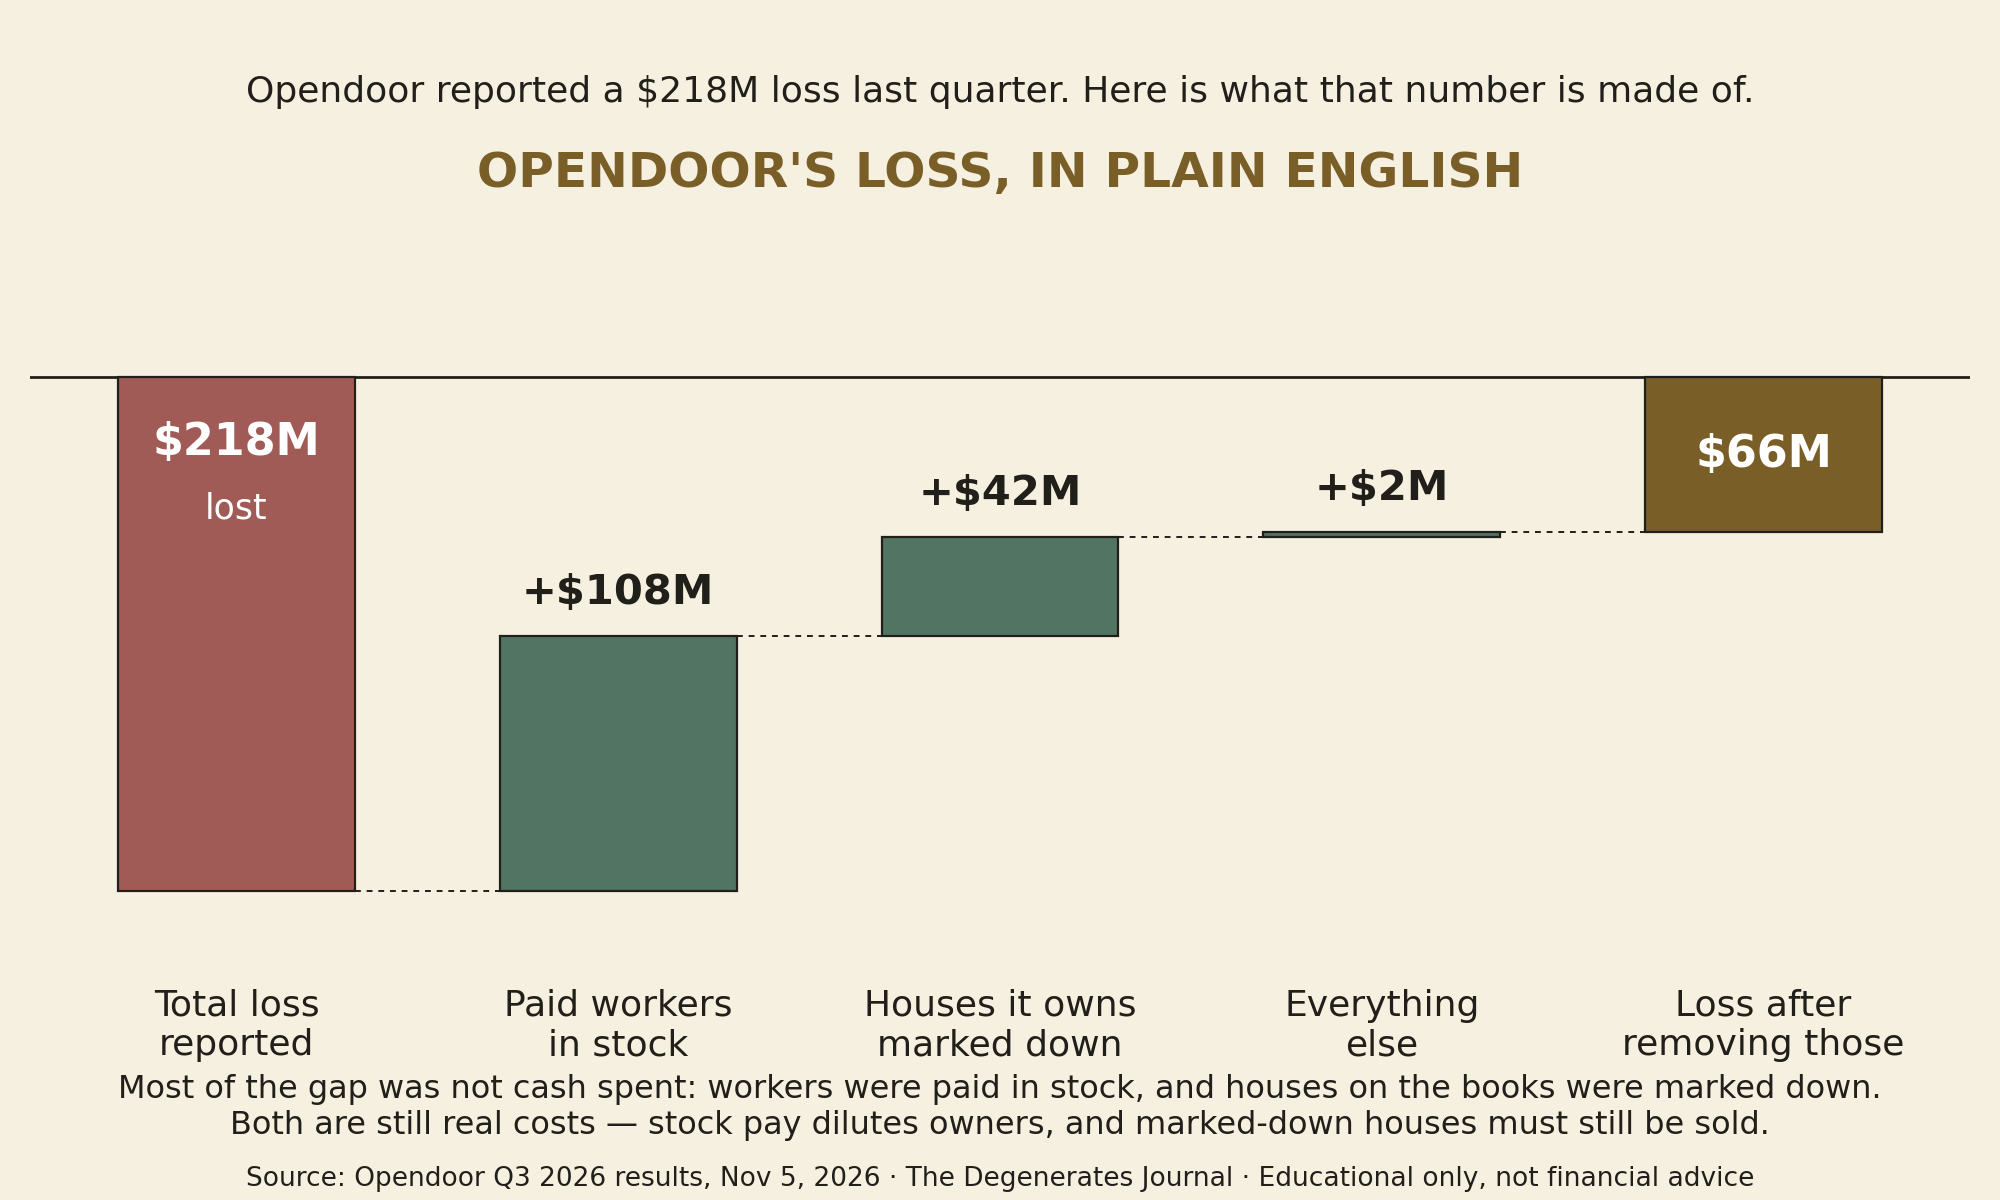
The bridge in plain English. Most of the gap was not cash spent — but both pieces are still real costs: stock pay dilutes owners, and marked-down houses must still be sold. Source: Opendoor Q3 2026 results, November 5, 2026.
Two honest warnings. First, calling the whole loss a "restructuring cost" would be wrong — the restructuring line this quarter is zero. The company is rebuilding strategically while booking ordinary costs under their real names. Second, "noncash" does not mean "doesn't count." Stock pay doesn't drain the bank account today; it takes value from shareholders through dilution instead. And the adjusted figures also strip out financing costs — for a company that borrows money to hold houses, financing is not a footnote. It is the business.
The resale engine itself is thin right now. Gross margin fell to 3.7%, from 7.2% a year ago. Contribution profit was $34 million, a 3.3% margin — down from 5.8% in Q2, and management guided contribution dollars lower again for Q4. Adjusted EBITDA lost $31 million in the quarter, and Q4 guidance is worse: a $70–85 million adjusted EBITDA loss, even with revenue guided up at least 40% year over year.
One house through the machine — built from Q3's reported averages, rounded, so treat it as the shape of the economics, not any real home. Take a house that sells for $375,000 (the average price in management's own breakeven framework). At Q3's 3.7% gross margin, about $13,900 survives the purchase, renovation and resale. At the 3.3% contribution margin, about $12,400 survives direct selling costs too — close to the roughly $12,000 of contribution per home the company reported. Still unpaid out of that $12,400: head-office costs, and the interest on the money borrowed to hold the house while it waits for a buyer. That is how a company can earn a positive contribution on the average home and still lose $218 million in a quarter.
Section 05Cash and survival: the real math
Nine months to September 30, from the 10-Q: operating cash outflow of $1.796 billion. That sounds fatal until you open it — $1.703 billion of it is the inventory line, cash spent buying homes that comes back when they sell. Strip that line out arithmetically and the operating outflow is $93 million. That is not free cash flow and not a runway number; it is a decomposition. But it is the right way to look at a home buyer, and it is why dividing the cash balance by one quarter's GAAP loss produces a misleading survival estimate — in both directions.
Note the imbalance inside the inventory number: Opendoor bought 4,865 homes in Q3 and sold 2,728 — buying at nearly twice its selling pace, with inventory roughly two and a half times a year ago, heading into winter. After quarter-end, new senior facilities lifted total capacity to $8.5 billion, of which $2.1 billion is fully committed. Capacity is not unrestricted cash, and the relevant questions are collateral eligibility, advance rates, covenants and maturities. The stress test is simultaneous pressure: slower sales tie up cash longer, lower prices can impair collateral, and financing can become less attractive precisely when the company needs time to sell.
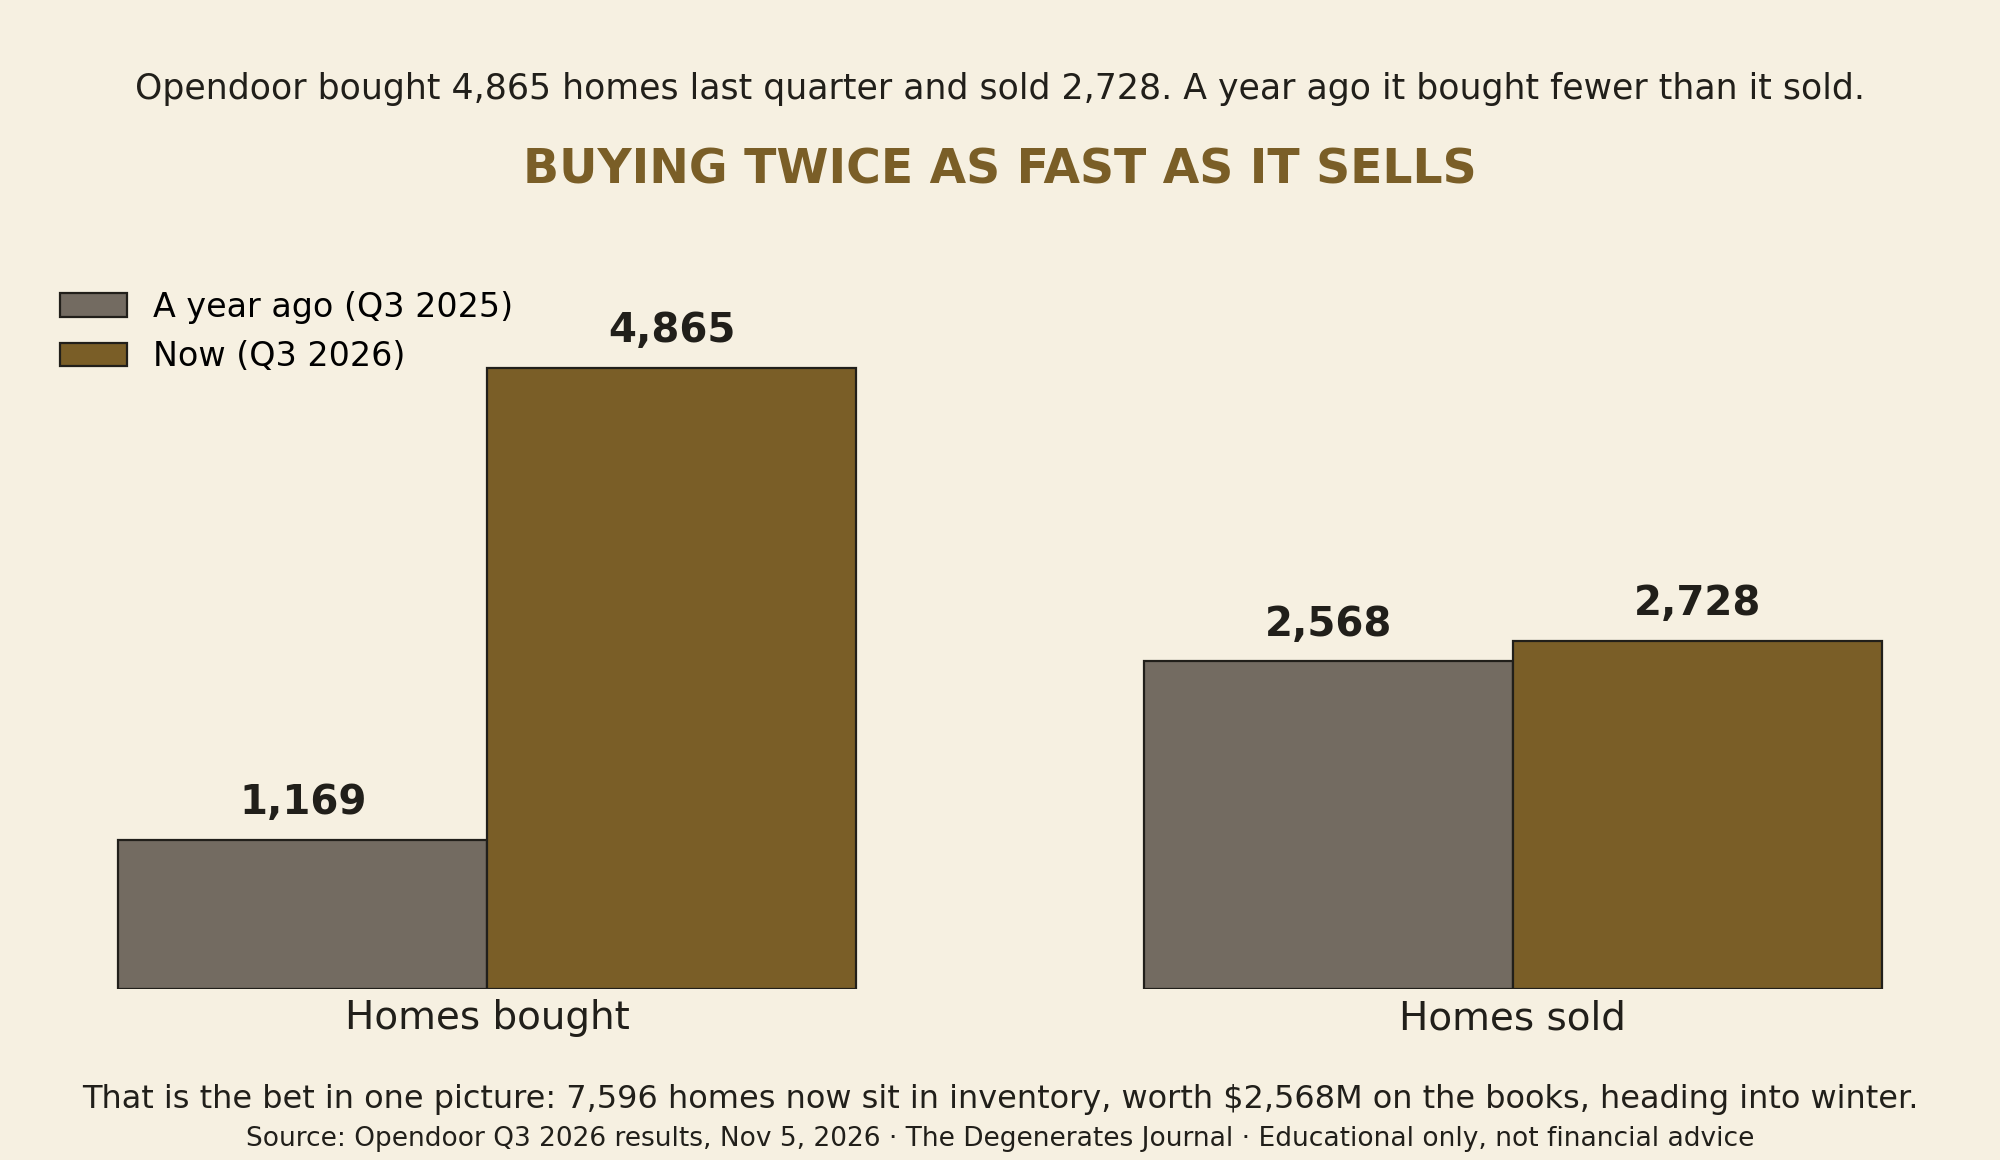
The bet in one picture. Inventory now stands at 7,596 homes carried at $2,568M, heading into winter. Source: Opendoor Q3 2026 results, November 5, 2026.
Section 06The actual product shift: 1P, 2P, 3P in plain words
This is the whole thesis. Management laid it out on the Q2 2026 call in August, in e-commerce language. 1P is the original model: Opendoor buys your house for cash at an agreed price, and owns the risk — funding, repairs, resale. 2P is "Cash Now, More Later": you get cash upfront and keep it no matter what — that part is guaranteed by the product's own terms — while a second payment may follow, but is not guaranteed; it depends on the resale making money after fees and costs. Opendoor still buys the home, but with less capital committed upfront. 3P: Opendoor never buys the house. It helps you list and sell to someone else, and earns service fees. "List with Opendoor," launched in late October, is the first of these products; on the buy side, "Buy with Opendoor" is still a waitlist product in Texas.
Nejatian's own words on the Q2 call: "We're on step 2 right now, and we're not going to move to step 3 until we are really good at step 2."
Why it matters: every week, roughly 9,000 serious sellers reach Opendoor's platform — management's term is "true sellers" — and only around 500 end in an acquisition contract. For years, the other 8,500 mostly went elsewhere; in the CFO's own words, most of the rest "go on to list their homes." A platform that can serve even a slice of them — without buying their homes — earns more from demand it already has, with far less capital per customer. Homes purchased jumped 316% in Q3 to 4,865, and more than 7,000 contracts were signed in the quarter. The funnel is not the problem. Monetizing it profitably is.
Why the labels matter: a 1P sale books the full home price as revenue and puts the house on Opendoor's balance sheet. A 3P sale books only a fee — far less revenue, far less capital, far less risk. Comparing the two models on revenue alone will mislead you in both directions. Judge the transition on transactions served, contribution per transaction, and capital employed — not on the top line.
Section 07What massive scale requires
Illustrative arithmetic — our assumptions, not Opendoor's fees, guidance or a forecast. If a completed 3P transaction contributed $2,000 after the real costs of delivering it — commissions, incentives, servicing, allocated acquisition cost — then 50,000 closings a year would produce $100 million before central overhead and taxes. At $1,000 a transaction, the same volume produces half as much. A large addressable market does not determine which outcome occurs.
The funnel can matter more than any advertising campaign. If better conversion turned just 5% more of those 9,000 weekly sellers into completed service customers, that is roughly 23,400 extra transactions a year — about $46.8 million at the same assumed $2,000 contribution, before added central costs. The calculation assumes 52 comparable weeks, unique eligible customers, incremental closings and no cannibalization of profitable 1P sales. Repeated visits, cancellations, local availability and promotional discounts could sharply reduce the result. Financing, title and escrow can add value, but their gross fees cannot simply be stacked as profit — the costs of delivering them come out first.
Section 08The rental hypothesis — honestly labelled
Opendoor does not rent homes today. Its own site says so, plainly, on a page warning about rental scams, and nothing about rentals is an announced plan. Treat everything in this section as a strategic scenario, not a roadmap.
The credible path runs through the homeowner's next decision: the seller who decides not to sell and needs a tenant instead; the family relocating who needs a furnished home for a few months; the owner who wants help running a rental. Leasing help and relocation stays fit what Opendoor already touches. Building a guest marketplace to fight Airbnb head-on is a different company — Airbnb counts more than 5.5 million hosts and over 2.5 billion lifetime guest arrivals, and a database of houses is not a travel network. Rentals are an expansion Opendoor would have to earn. The core business cannot need them to work.
Section 09What sellers and buyers actually report
Everything above comes from filings and calls — the company's voice. The customer record tells a more divided story, and the first thing to know about it is that the platform you read decides the verdict. As of November 2026: Trustpilot shows 3.9 out of 5 across roughly 900 reviews; Reviews.io shows 4.4 across more than 3,400 — that is the score Opendoor itself displays; the Better Business Bureau's customer reviews sit near 1.2–1.5 out of 5 across about 164 reviews, alongside an A+ BBB letter rating; Google shows 1.5 across a small sample. One independent aggregation of 4,474 reviews across platforms found 75% five-star and 19% one-star. This is a bimodal product: most customers report either a smooth, fast sale or a miserable one.
The most useful single analysis is Clever Real Estate's coding of 1,310 reviews (a third-party analysis, updated August 2026). The praise clusters where you'd hope: smooth process 59%, strong customer service 37%, good communication 19%, competitive offers and fees 17%. The complaints cluster too: frustrating process 14%, lowball offers 13%, broken promises 12%, excessive fees 7% — and buyers of Opendoor homes (shoddy repairs, hidden defects, 6%) are markedly more negative than sellers. The recurring theme a seller should plan around is the one at the top of the complaint list: the final offer can come down after the assessment. The repair deduction — the company calls it a "condition adjustment" — is Opendoor's own internal estimate, not a contractor's quote, and a further visit after contract can still revise the offer. None of that makes the product a bad deal; speed and certainty are real, and 59% smooth-process praise is not nothing. It means the headline offer is a starting point, not a promise — a fact the company's own fine print supports: Opendoor's public dashboard concedes its contract counts are not adjusted for later cancellations, its figures are unaudited estimates, and it publishes no customer-satisfaction metric at all.
Section 10What this means for you
If you're selling a home: Opendoor publishes no fixed service charge in 2026 — its help pages say the charge varies and appears only in your offer. Historically it ran about 5%; third-party estimates now put it at 5–8%, plus roughly 1–3% in closing costs, plus whatever repair deduction the assessment produces. The fee is not negotiable and there is no counter-offer process. What you get for it: you pick a closing date 21–60 days out, you can cancel free any time before closing, and proceeds wire within about two days of escrow. The traditional route, for comparison, runs about 5.5% in total commissions (2026 agent surveys), a median 50 days on market, and another 30–45 days to close — roughly 80–95 days from listing to funded, with a higher expected price and no certainty. Opendoor sells certainty and a calendar. Price them as such.
If you're buying a home: Opendoor's own help pages confirm offers below list price are considered — weighed against days on market and offer strength — and its checkout product prices at a fixed 1% below list in the states where it operates. The leverage sits in the stale end of its book: 18% of its listed homes had been sitting more than 120 days at the end of Q3 (the overall market's share is 30%, but Opendoor, unlike a homeowner, is paying interest on every one of them). Every Opendoor home also carries a 100-day warranty, introduced in October 2025. Patient buyers are negotiating against a financing clock.
If you hold the stock: you don't need to watch the stock — watch five numbers, in the Q4 results expected in February. Gross margin against 3.7%. Contribution margin against 3.3%. Homes sold against the 6,000-a-quarter yardstick management itself supplied. Inventory against 7,596 homes. And the capital-light share of new business against the roughly 50% mark the company cited for its latest week. Those five prints, graded in Section 11's terms, will say more than any single day's price move.
Section 11The scoreboard: what would prove it, what would kill it
Management's goal is adjusted net income turning positive by the end of 2026, measured on a 12-month go-forward basis. On Thursday's call they said it straight: "We are currently behind but we intend to catch up." Earlier this fall the slip was quantified at roughly six to eight weeks. Management's own breakeven yardstick — an illustrative framework from last quarter, not formal guidance — is roughly 6,000 transactions a quarter at about $375,000 a home, some $2.25 billion of quarterly revenue. Q3 sold 2,728 homes. That gap is the distance between the story and the proof.
| Test | Evidence that would strengthen the case |
|---|---|
| Core economics | Realized returns on newly bought homes improve after financing — including the slow sellers, not just the quick flips. |
| 3P adoption | Signed listings become closed transactions with positive net contribution — not just signups. (The company itself warns its contract counts are not adjusted for later cancellations.) |
| Service attachment | Customers add mortgage, title and other services without discounts and incentives consuming the profit. |
| Capital efficiency | Interest and equity capital tied up per comparable transaction decline. |
| Shareholder economics | Cash generation improves without dilution doing the heavy lifting. |
The bear case writes itself: automation trims office costs while house-price risk overwhelms the savings, and 3P becomes just another brokerage in a crowded field. There is a precedent — Zillow shut down its home-buying business in 2021 after concluding it could not predict prices well enough to carry the risk. Goldman Sachs reiterated Sell on Friday with a $1.00 target. The bull case survives only if customers genuinely value the one-stop experience and realized margins recover while the company owns less, not more. If the five tests move, today's losses will look like the cost of a rebuild. If they don't, they were just losses.
Section 12What we could not verify
The settlement date of the latest short-interest figure (about 24% of shares outstanding, roughly 28% of the float) — aggregators displayed it on November 6–8 without a visible settlement date. The exact September 2025 intraday peak of the meme rally — secondary sources give $10.52 and $10.87; this piece claims only "above $10." One live discrepancy we did not resolve: the Q3 call transcript describes Buy with Opendoor launching in the Bay Area, while the product's own live page is a Texas waitlist and the CEO's launch post says Texas — we used the product page. One widely syndicated market report claiming a 2025 "Opendoor Rentals" launch could not be corroborated anywhere and is contradicted by Opendoor's own FAQ; we treat it as erroneous. Post-earnings analyst actions beyond Goldman Sachs' November 6 reiteration: none found by November 8 — absence is reported, not proof none exists. How often Cash Now, More Later sellers receive a second payment, and how large: no aggregate data exists anywhere we could find — only individual anecdotes, which we did not use. Opendoor publishes no fixed service-charge percentage and no typical repair deduction; the fee figures in Section 10 are historical figures and third-party estimates, labelled as such where they appear. Customer-review scores move over time and differ sharply by platform; Section 09 reports the pattern across platforms rather than any single score.
Sources — Opendoor Q3 2026 results release (GlobeNewswire, November 5, 2026): revenue, the GAAP-to-adjusted reconciliation, margins, volumes and Q4 guideposts. Opendoor Form 10-Q for the quarter ended September 30, 2026 (SEC, filed November 5, 2026), read on EDGAR: cash flows, balance sheet, debt, inventory, and Note 19 on the post-quarter facilities. Opendoor Q2 2026 earnings call (August 4, 2026) and Q3 2026 earnings call (November 5, 2026), transcripts: the 1P/2P/3P framing, the "step 2" and "currently behind" remarks, the weekly seller funnel. Opendoor's own product pages: Cash Now, More Later terms; Buy with Opendoor (Texas waitlist, read live November 8); the rental-scam guidance page ("Opendoor doesn't rent homes"). Airbnb Q3 2026 results (November 5, 2026): hosts and guest arrivals. Market data for the November 6 close, share count (10-Q cover, October 29, 2026) and short interest. Analyst actions via ratings feeds: Goldman Sachs (November 6), UBS (October 28), JPMorgan (September 11). Customer experience and selling costs: review pages on Trustpilot, Reviews.io, the Better Business Bureau and Google (read November 2026); Clever Real Estate's coded analysis of 1,310 Opendoor reviews (updated August 2026), its resale-spread study and its 2026 commission surveys; Redfin housing-market data (October 2026) for days on market; Opendoor Help Center pages on the service charge, selling options, and negotiating a purchase (read live November 8, 2026); Opendoor's accountable dashboard (read live November 8, 2026 — its counts are unadjusted for cancellations and unaudited, per its own footnotes). Adapted from "Opendoor: The Cost of Rebuilding," The Degen Journal research, November 8, 2026. Illustrative scenarios are the author's analysis, not forecasts. No price target is offered.