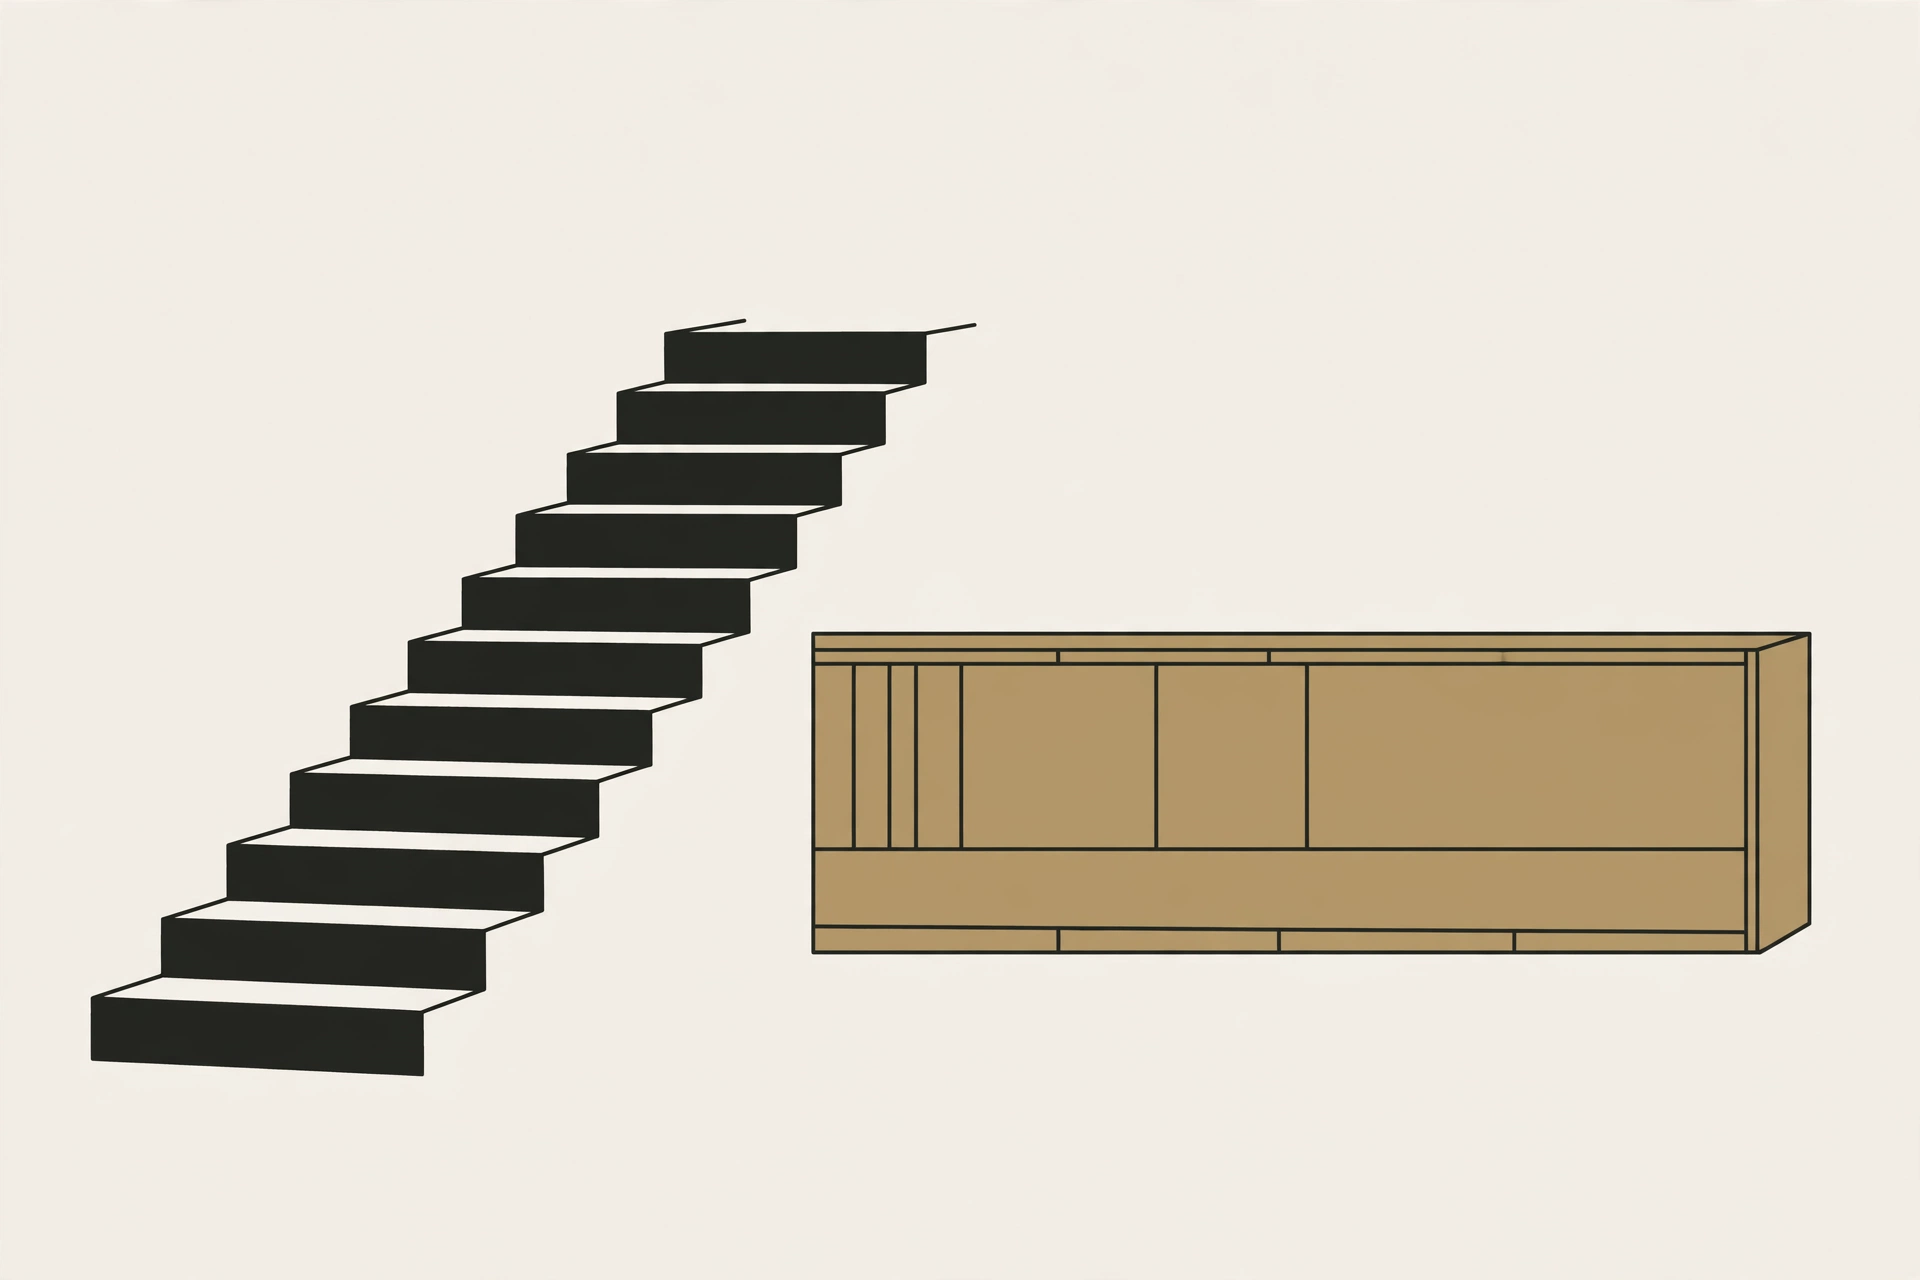
Trends: the staircase
An uptrend is a staircase: each peak higher than the last (higher highs), each dip shallower than the last (higher lows). Price advances in waves — push up, partial retreat, push higher. A downtrend is the same staircase inverted: lower highs, lower lows. The pattern is the definition; if you cannot point to the steps, there is no trend, whatever the headlines claim.
Ranges: the hallway
Sometimes price goes nowhere for weeks: bouncing between a ceiling and a floor, making no progress either way. This is a range — the hallway between two walls. Ranges are not failed trends; they are their own regime, with their own behavior. Most markets spend most of their time in ranges. The trend is the exception that gets remembered.
Why the distinction matters
Expectations should match the regime. In a staircase, pullbacks toward the last step have a history of holding — until they don't. In a hallway, extremes have a history of reversing — until the hallway breaks. Acting on staircase expectations inside a hallway (or vice versa) is one of the most common ways chart readers get hurt. Name the regime first; everything else follows.
Transitions are the messy middle
Regimes change, and the change is never clean. A staircase breaks when a dip goes lower than the last one — but one broken step can also just be noise before the staircase resumes. The honest approach: wait for confirmation rather than calling the turn. The first sign of a regime change is information; the confirmed change is the regime. Between them lies the choppiest water in markets, where the most money is lost to premature certainty.
Higher timeframes rule
Structure exists on every timeframe simultaneously — and they often disagree. A daily staircase can sit inside a weekly hallway. When they conflict, the longer timeframe usually wins: it represents more capital, more participants, more conviction. Before trusting any structure, check one timeframe above the one you are reading. Context is seniority.
Structure describes, never predicts
This is the hardstop of chart reading: structure tells you what regime you are in, not what happens next. Staircases end. Hallways break. The value of naming the regime is honest expectations — knowing what behavior is normal here, and what would signal change — not a forecast. Anyone selling structure as prediction is selling something structure does not contain.
Worked example: Labeling the swings
Illustrative sequence, to practice naming structure.
| Swing | Price | Label |
|---|---|---|
| Peak 1 | $52 | — |
| Dip 1 | $48 | — |
| Peak 2 | $55 | Higher high |
| Dip 2 | $51 | Higher low |
| Peak 3 | $58 | Higher high |
| Dip 3 | $54 | Higher low |
Each peak above the last, each dip above the last: the staircase is intact. The day a dip prints below $54, the structure — not the trend's reputation — is what changed.